How much equipment does an economy need for continued production to be worthwhile?
01 · THE MACHINES
The cost of stopping production
Higher taxes, less production.
This cycleProduction this cycleTotalTotal production accumulated
No taxes
100
100
This cycleProduction this cycleTotalTotal production accumulated
You choose the tax
39
39
Compare production
Move the slider to choose the tax. Raise it until the machine shuts down. Then lower it and watch production restart.
No taxesHigher taxes
At the skull marker, output reaches zero. One step beyond it starts shutdown.
What is happening
The machine on the right produces less. The gap grows while the one on the left keeps running.
The skull marks an illustrative limit, not an estimated tax rate for an actual economy. The animation shows lost output, shutdown and the work needed to reopen. In the plain language paper, equipment wears out gradually when output cannot pay for replacements.
How production is counted
A full tube represents 100 illustrative units. Each counter records only what its machine produces. “This cycle” resets when the next fill begins; “Total accumulated” keeps output since the last reset. Emptying the tubes does not subtract output. RESET empties the tanks with their normal motion and clears the counters. It always acts on the left machine and, if it is operating, on the right one too. It does not change the tax or interrupt repairs. When the machine without taxes reaches 10,000, both totals reset. Repairs represent the time and resources needed to reopen; their cost is not deducted from these counters.
The machines represent capital; the green liquid represents output. Repairs show the time, work and investment needed to produce again.
Here the tax represents a burden that reduces resources for production and maintenance. Actual deterioration can be gradual. The skull marks an illustrative limit, not a tax rate calculated for a real economy.
Lowering the tax makes reopening possible.
The output lost during the shutdown cannot be recovered.
Removing the burden makes investment possible again, but does not restore lost equipment by itself. Rebuilding takes resources and work. The pin factory shows how organizing that work can raise output.
02 · THE DIVISION OF LABOR
The pin factory
Productivity took off with the Industrial Revolution. Adam Smith used a pin factory to explain how dividing tasks allows more output.
Watch the walking, the machines waiting and those working at the same time. Then compare the counters.
Shared time
To compare from zeroChoose workers → Wait until they are in place → Reset
YOU CHOOSE
One worker, three tasks
One worker performs all three tasks and walks between the machines.
pins
Workers
THREE DEDICATED WORKERS
A specialized factory
Each worker performs one task.
pins
3workers
Metal bead
Headless pin
Finished pin
More workers and better organization allow more output.
With three workers, each stays at one machine. No one loses time walking, and the stages can work at the same time whenever they have a piece available.
“when I specialize, I save time, and that allows me to be more productive”
Here you add workers and divide tasks among the same three machines. Expanding scale means increasing equipment and labor together. If doubling both more than doubles output, there are increasing returns to scale.
03 · THE GREAT TAKEOFF
Producing more changes lives.
01
For centuries, life was mostly about survival.
Almost all effort went into finding food, clothing and shelter. The Industrial Revolution changed production. Better tools and better organization of work made far more output possible.
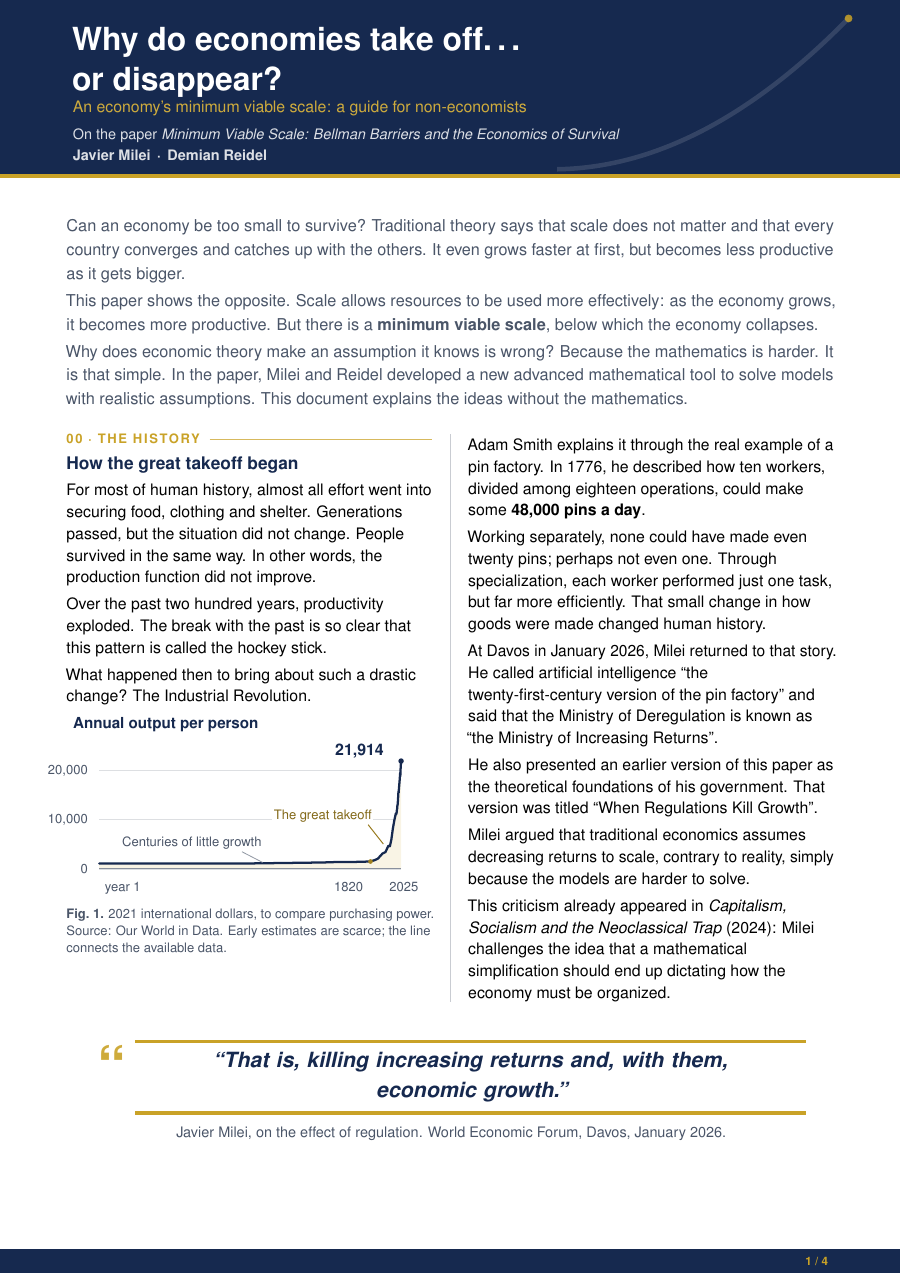
The jump was so large that the curve looks like a hockey stick. Producing more per person makes a better life possible. To explain that jump, theory must account for how expanding production can make resources more productive.
Progress also made life longer. In 1800, early in the industrial era, global life expectancy at birth was about 29 years. By 2023, it had reached 73. Better nutrition, clean water, sanitation and medicine reduced child deaths and helped adults live longer.
FOLLOW THE ARGUMENTScroll to explore ↓
Annual output per person ↑
1820
1,500
2025
21,914
Year →
World output per person
For centuries, life was mostly about survival.01 / 01
World output per person. International dollars at 2021 prices: adjusted for inflation and differences in prices.Chart source and data
Gross domestic product (GDP) measures what an economy produces. Dividing it by population lets us compare output per person. Early observations are sparse: lines connect available data. The chart shows historical change; by itself, it does not identify its causes.
Eurostat, OECD, IMF, and World Bank (2026); Bolt and van Zanden – Maddison Project Database 2023; Maddison Database 2010 – with major processing by Our World in Data. “Global average GDP per capita over the long run – Maddison Database, Maddison Project Database, World Bank – In constant international-$. Historical data” [dataset]. Eurostat, OECD, IMF, and World Bank, “World Development Indicators 129”; Bolt and van Zanden, “Maddison Project Database 2023”; Angus Maddison, “Maddison Database 2010” [original data].
He searches where there is light. The key is elsewhere.
A man searches for a key under a streetlight. Someone asks if he lost it there. “No, I lost it over there, in the dark. But there is light here.”
That is what traditional economic theory often does. We have already seen that increasing returns to scale generally prevail in the real world. Yet economics textbooks make precisely the opposite assumption: doubling machines and workers produces less than twice the output.
But why make an assumption they know is false? The reason is one of economics’ most embarrassing open secrets: traditional mathematical tools cannot solve the model with the correct assumptions. So instead of correcting the model, they “correct” reality.
That is searching under the streetlight: studying what the tool can solve, even when the problem lies elsewhere. Milei criticizes the consequence: they turn increasing returns to scale into a market failure instead of recognizing them as the engine of growth that allowed the world to escape poverty.
“That is, killing increasing returns and, with them, economic growth.”
Instead of “correcting” reality, we correct the model and incorporate increasing returns.
We develop a new mathematical tool: First Passage Bellman Barriers. With this tool, we can solve the model using assumptions that reflect reality.
We find that under these conditions there is a minimum viable scale below which economies disappear: they do not grow and consume all their capital. This contradicts traditional results that say economies always grow, catch up with larger economies and, in fact, grow faster the smaller they are. In our paper, we find that economies that are too small lack the scale to survive. And this scale depends, among other things, on the obstacles the government itself creates. This is one of the important foundations of Javier Milei’s economic philosophy: stop getting in entrepreneurs’ way so the economy can grow.
That is our flashlight: a tool for understanding the real economy when the usual methods are not enough.
And we find the key.
“When the model fails, don’t get angry with reality. Get angry with the model and change it.”
He searches where there is light. The key is elsewhere.01 / 02
The key represents the minimum viable scale.
He finds the key, opens the door and walks out.
PDF To read and share
The ideas, explained.
How scale and specialization allow more output, why maintaining equipment takes investment and how burdens can destroy future production. The plain language paper develops these ideas without mathematics.